


 42 / 57

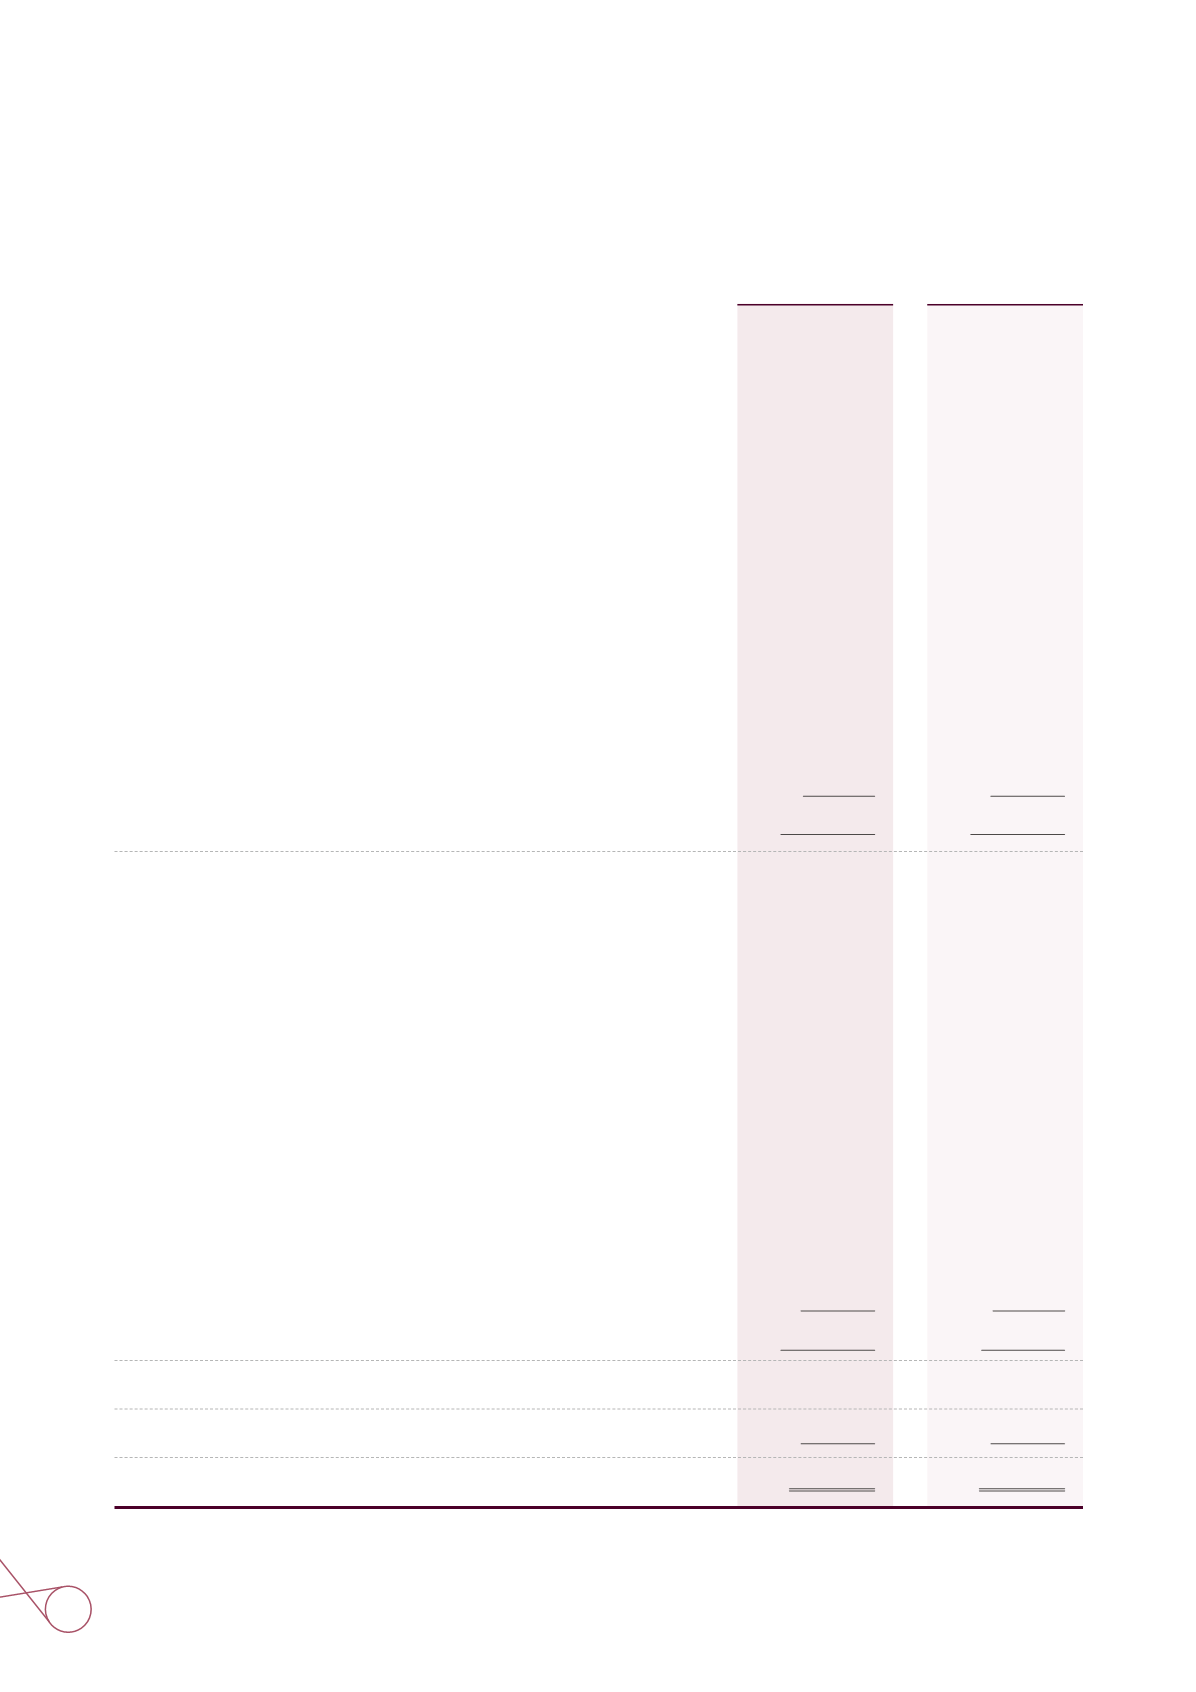
CASH FLOWS FROM INVESTING ACTIVITIES
Purchase of financial assets measured at cost
Refund of financial assets measured at cost received
Purchase of investments accounted for using equity method
Payments for property, plant and equipment
Proceeds of the disposal of property, plant and equipment
Payments for intangible assets
Increase in refundable deposits
Decrease in refundable deposits
Increase in oil and gas interests
Dividends received from associates and others
Other long-term receivables
Decrease (increase) in other non-current assets
Net cash generated from operating activities
CASH FLOWS FROM FINANCING ACTIVITIES
Proceeds of short-term borrowings
Repayments of short-term borrowings
Proceeds of short-term bills payable
Repayments of short-term bills payable
Proceeds of issue of bonds payable
Repayments of bonds payable
Repayments of long-term borrowings
Proceeds of guarantee deposits received
Refund of guarantee deposits received
Increase (decrease) in other non-current liabilities
Decrease in bank overdraft
Net cash generated from financing activities
NET INCREASE (DECREASE) IN CASH AND CASH EQUIVALENTS
CASH AND CASH EQUIVALENTS AT THE BEGINNING OF THEYEAR
CASH AND CASH EQUIVALENTS AT THE END OF THEYEAR
(2,427,001)
-
(528,000)
(16,127,183)
209,640
-
(29,087)
118,569
(16,728,942)
3,197,007
(807,489)
1,227,927
(31,894,559)
74,624,909
(67,999,978)
525,351,797
(517,184,384)
30,000,000
(8,070,000)
(17,220,000)
1,468,569
(2,589,541)
(25,302)
(199,126)
18,156,944
(6,663,041)
9,004,218
$2,341,177
2015
2014
-
165,758
(1,053,000)
(17,688,538)
247,166
(86,455)
(52,245)
48,181
(8,435,436)
2,318,656
(2,733,892)
(533,386)
(27,803,191)
110,870,871
(86,410,405)
321,001,586
(403,656,561)
13,300,000
(9,300,000)
(20,600,000)
645,130
(1,329,127)
130,499
1,218,846
(74,129,161)
(72,818)
2,341,177
$2,268,359
42 CPC 2016