


 40 / 57

2015
2014
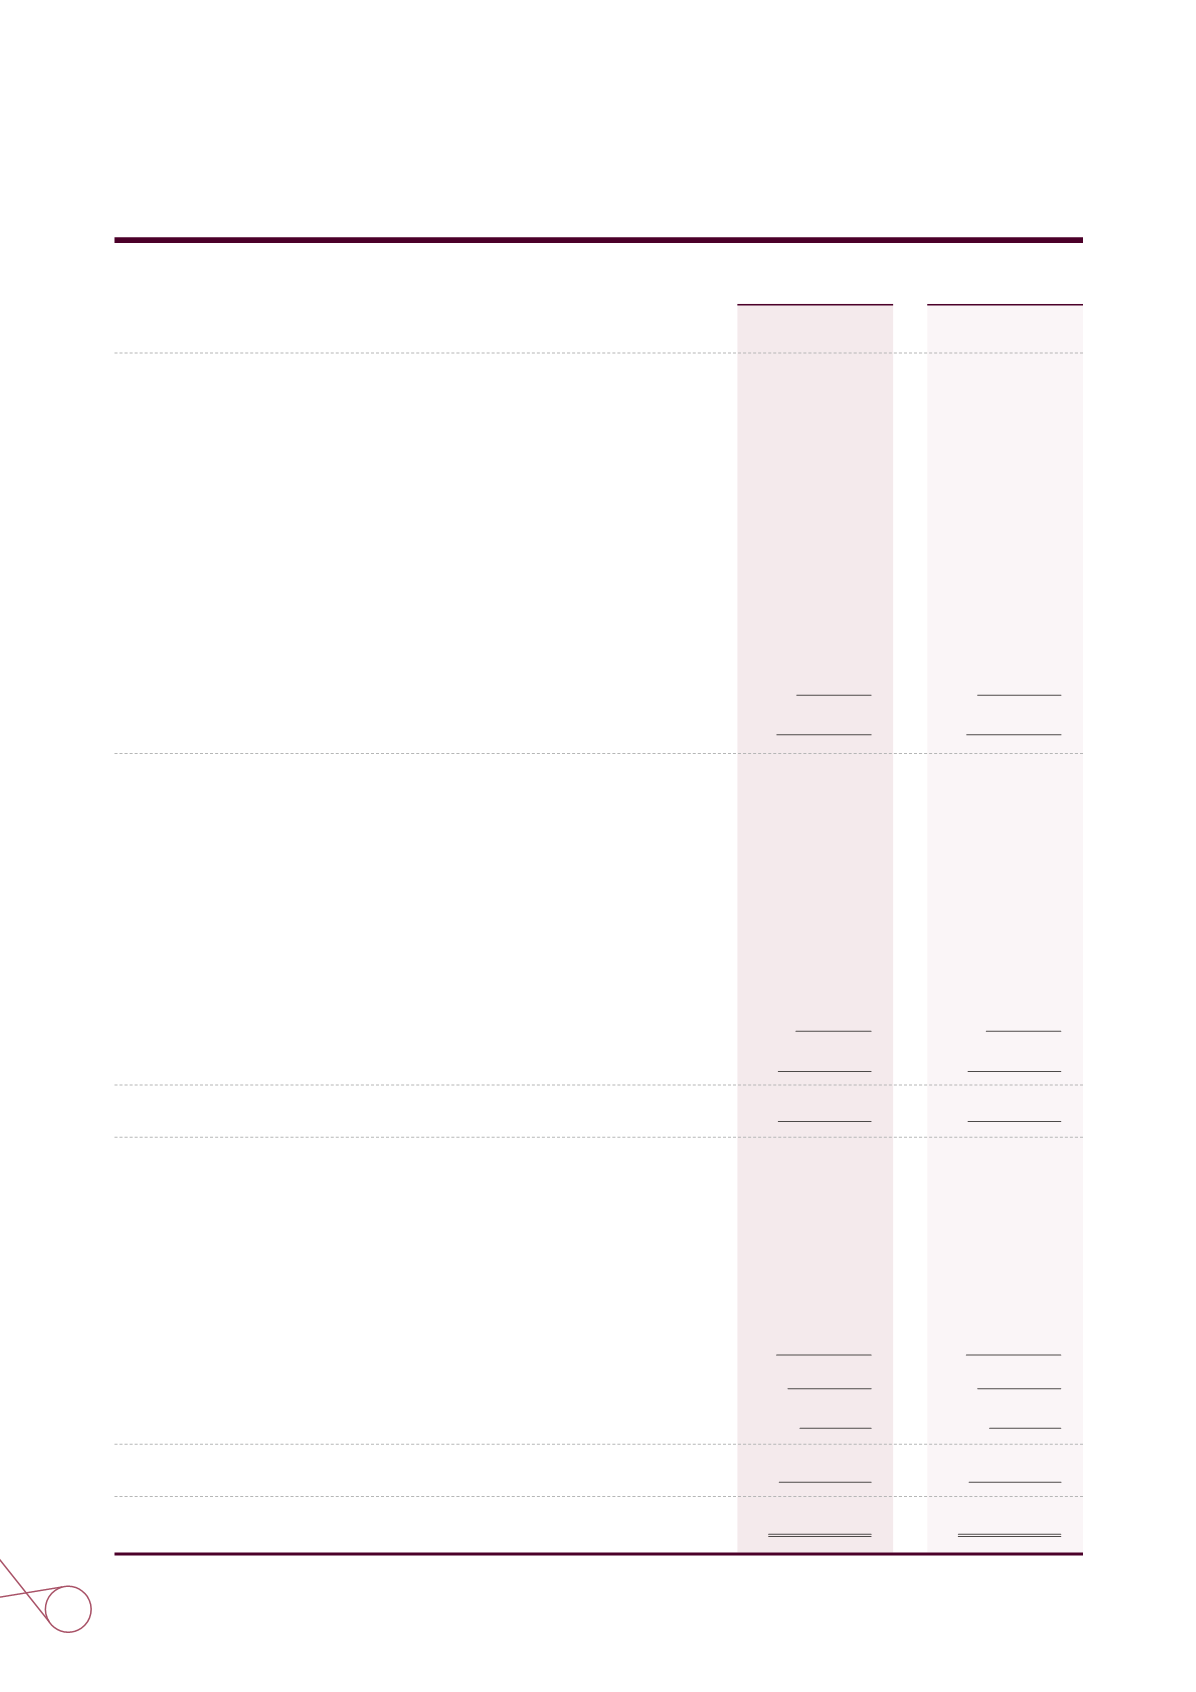
BALANCE SHEETS
December 31, 2015 and 2014
(In Thousands of New Taiwan Dollars)
Liabilities and Equity
Current Liabilities
Short-term borrowings
Short-term bills payable
Derivative financial liabilities for hedging - current
Trade payables
Payable to constructors
Other payables
Receipts in advance
Current portion of long-term borrowings and bonds payable
Other current liabilities
Total Current Liabilities
Noncurrent Liabilities
Bonds payable
Long-term borrowings
Provisions - noncurrent
Deferred tax liabilities
Post-employment benefits payable
Guarantee deposits received
Other noncurrent liabilities
Total Noncurrent Assets
Total Liabilities
Equity
Share capital
Common shares
Retained earnings
Special reserve
Unappropriated earnings (accumulated deficits)
Total retained earnings
Other equity
Total Equity
Total Liabilities and Equity
$60,020,467
95,743,646
0
25,958,273
3,010,099
17,406,612
8,268,331
30,300,000
7,703,430
248,410,858
137,600,000
40,320,000
28,022,585
85,099,088
4,024,347
1,051,185
5,294,391
301,411,596
549,822,454
130,100,000
127,824,598
(65,265,769)
62,558,829
(515,393)
192,143,436
$741,965,890
$34,340,900
178,398,622
12,177
36,313,012
2,433,713
19,696,366
10,053,518
29,900,000
14,412,962
325,561,270
134,900,000
60,020,000
28,053,277
85,050,903
491,596
1,010,313
5,019,719
314,545,808
640,107,078
130,100,000
127,928,807
(63,495,227)
64,433,580
(936,155)
193,597,425
$833,704,503
40 CPC 2016