
Page 66 - 2023 CPC Corporation,Taiwan
P. 66
64
Financial Statements
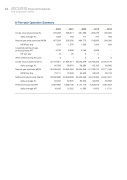
� ��������� ��������� �������
Crude oil produced-total KL daily average KL
Natural gas produced-total MCM MCM per day
�������� ��������� ���
produced-total MT MT per day
Wells drilled during the year Crude oil processed-total KL daily average KL
Natural gas sold-total MCM MCM per day
������ �������� ���������� ��
daily average KL Petrochemicals sold-MT
daily average MT
����
375,283 1,028 457,208 1,253
4,729 13 3 22,187,561 60,788 26,539,452 72,711 22,630,890 62,002 3,807,983 10,433
����
285,671 783 502,328 1,376
8,999 25 1 21,854,071 59,874 25,560,250 70,028 22,949,808 62,876 4,388,136 12,022
����
261,688 717 494,772 1,356
2,184 6 3 20,543,276 56,283 23,554,348 64,532 30,453,406 83,434 4,147,178 11,362
����
265,278 727 519,833 1,424
3,929 11 3 23,763,205 65,105 21,733,213 59,543 34,312,260 94,006 4,253,913 11,655
����
180,062 493 240,026 658
-
- 2 22,213,776 60,860 22,171,345 60,743 34,661,601 94,963 4,281,652 11,731
