
Page 65 - 2023 CPC Corporation,Taiwan
P. 65
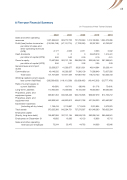
� ��������� ��������� �������
(In Thousands of New Taiwan Dollars)
63
Sales and other operating revenues
����� ������ ������ ������ ���
per dollar of sales and other operating revenues (NT$)
Cash dividends
per dollar of capital (NT$)
Owner’s equity
per dollar of capital (NT$)
General taxes and import duties
Commodity tax
Total taxes
Working capital (current assets less current liabilities)
Ratio of current assets to current liabilities
Long-term Liabilities Properties, plant, and equipment-gross Properties, plant, and equipment-net
Exploration expenses (including all dry holes)
Total assets
Employed capital (Equity, long-term debt)
Employees on December 31
Sales and other operating revenues per employee
����
1,221,856,842 (216,055,749)
-0.177 0
0.00 73,497,958 0.56
52,559,557
49,148,032 101,707,589
(326,569,633)
48.09% 112,400,000
948,901,353 462,939,340
1,758,418 973,525,368
185,897,958 16,682
73,244
����
903,772,722 (47,131,715)
-0.052 0
0.00 262,121,184 2.01
41,285,677
66,285,387 107,571,064
(118,101,309)
64.71% 75,000,000
940,305,423 446,820,912
2,119,987 842,284,751
337,121,184 16,293
55,470
����
721,700,943 (7,703,206)
-0.011 0
0.00 294,099,129 2.26
36,921,621
71,066,139 107,987,760
(62,628,400)
69.84% 75,150,000
924,745,805 434,621,786
1,712,403 737,278,927
369,249,129 16,123
44,762
����
1,014,108,034 33,337,332
0.033 24,678,319
0.19 306,048,146 2.35
46,614,084
71,598,649 118,212,733
(48,410,303)
81.17% 76,050,000
909,097,079 421,334,223
2,031,934 801,948,280
382,098,146 15,836
64,038
����
1,034,575,286 43,762,837
0.042 1,314,441
0.01 297,598,941 2.29
58,228,141
72,007,592 130,235,733
(52,777,478)
79.91% 88,050,000
914,752,212 423,460,997
2,573,975 769,502,334
385,648,941 15,712
65,846
