
Page 45 - CPC 2018 Annual Report
P. 45
FINANCIAL STATEMENTS 43
2017
(25,334,373)
92,517,717 (92,234,111) 279,080,623
(300,430,973) 14,800,000 (15,250,000) (14,740,000) 2,136,363 (1,810,459) (21,418) (1,485,245) (37,437,503)
(1,102,503)
2016
(29,010,546)
82,813,472 (115,352,921) 214,328,705 (211,362,812) - (10,600,000) (19,700,000) 1,589,857 (1,333,514) 124,862 (812,624) (60,304,975)
395,986
2,664,345
2,268,359
$1,561,842
2,664,345
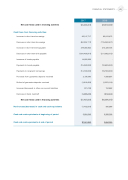
Net cash flows used in investing activities
Cash flows from financing activities:
Increase in short-term borrowings
Decrease in short-term borrowings
Increase in short-term bills payable
Decrease in short-term bills payable
Issuance of bonds payable
Payments to bonds payable
Payments to long-term borrowings
Proceeds from guarantee deposits received Refund of guarantee deposits received
Increase (decrease) in other non-current liabilities Decrease in bank overdraft
Net cash flows used in financing activities
Net increase (decrease) in cash and cash equivalents Cash and cash equivalents at beginning of period Cash and cash equivalents at end of period
