
Page 43 - CPC 2018 Annual Report
P. 43
FINANCIAL STATEMENTS 41
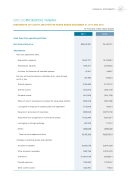
CPC CORPORATION, TAIWAN
STATEMENTS OF CASH FLOWS FOR THE YEARS ENDED DECEMBER 31, 2017 AND 2016
(In Thousands of New Taiwan Dollars)
2017
$48,542,061
2016
35,430,707
18,597,377 1,665,417 45,911
267,690
3,056,608 (372,561) (811,600) (628,443) (115,545) (689,662)
11,532,490 (92,302) (268,036) 32,187,344
(5,653,578) (388,136) (13,641,678) 1,098,563 1,002,972
19,759,245 2,009,202 56,857
126,254
3,510,135 (324,476) (451,706) (697,068)
80,501 (3,075,519) 5,891,361 111,510 (389,022) 26,607,274
(2,514,520) (1,374,257) 9,088,831 1,816,167 71,603
Cash flows from operating activities:
Net income before tax
Adjustments:
Non-cash adjustment items:
Depreciation expense
Amortization expense
Provision for (Reversal of) bad debt expense
Net loss on financial assets or liabilities at fair value through profit or loss
Interest expense
Interest income
Dividend income
Share of loss of associates accounted for using equity method Loss (gain) on disposal of property, plant and equipment Reversal of write-down of inventories
Impairment loss recognized on non-financial assets Loss (gain) on foreign exchange
Others
Total non-cash adjustment items Changes in operating assets and liabilities:
Accounts receivable
Other accounts receivable Inventories
Prepaid expenses
Other current assets
