
Page 65 - 2025 CPC Corporation,Taiwan
P. 65
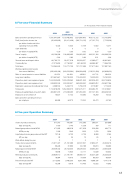
  A Five-year Financial Summary
/ Financial Statements
(In Thousands of New Taiwan Dollars)
  Sales and other operating revenues Profit (loss) before income tax
per dollar of sales and other operating revenues (NT$)
Cash dividends
per dollar of capital (NT$)
Owner's equity
per dollar of capital (NT$)
General taxes and import duties
Commodity tax
Total taxes
Working capital (current assets less current liabilities)
Ratio of current assets to current liabilities Long-term Liabilities
Properties, plant, and equipment-gross Properties, plant, and equipment-net Exploration expenses (including all dry holes) Total assets
Employed capital (Equity, long-term debt)
Employees on December 31
Sales and other operating revenues per employee
2024
1,097,341,659 (35,450,695)
-0.032 0 0.00 83,156,306 0.64 66,793,721 47,270,804 114,064,525
(290,433,436) 49.10% 301,651,667 1,044,042,829 539,900,044 4,068,164 1,112,618,318 384,807,973 16,637
65,958
2023 (certification)
1,103,482,602 (22,411,428)
-0.020 0 0.00 106,308,495 0.82 56,317,018 47,794,091 104,111,109
(343,519,094) 44.49% 163,750,000 1,000,418,062 503,242,547 5,423,110 1,052,353,015 270,058,495 17,142
64,373
2023
416,087 1,140 489,218 1340 9,123 25 1 21,167,289 57,993 26,143,305 71,625 27,197,197 74,513 3,495,200 9,576
2022
1,221,856,842 (193,719,131)
-0.159 0 0.00 124,950,250 0.96 52,559,557 49,148,032 101,707,589
(326,569,633) 48.09% 112,400,000 948,901,353 462,939,340 1,758,418 1,031,675,577 237,350,250 16,682
73,244
2022
375,283 1,028 457,208 1253 4,729 13 3 22,187,561 60,788 26,539,452 72,711 28,958,741 79,339 3,807,983 10,433
2021
903,772,722 (47,131,715)
-0.052 0 0.00 262,121,184 2.01 41,285,677 66,285,387 107,571,064
(118,101,309) 64.71% 75,000,000 940,305,423 446,820,912 2,119,987 842,284,751 337,121,184 16,293
55,470
2021
285,671 783 502,328 1,376 8,999 25 1 21,854,071 59,874 25,560,250 70,028 30,301,438 83,018 4,388,136 12,022
2020
721,700,943 (7,703,206)
-0.011 0 0.00 294,099,129 2.26 36,921,621 71,066,139 107,987,760
(62,628,400) 69.84% 75,150,000 924,745,805 434,621,786 1,712,403 737,278,927 369,249,129 16,123
44,762
2020
261,688 717 494,772 1,356 2,184 6 3 20,543,276 56,283 23,554,348 64,532 30,453,406 83,434 4,147,178 11,362
 A Five-year Operation Summary
  Crude oil produced-total KL daily average KL
Natural gas produced-total MCM MCM per day
Liquefied petroleum gas produced-total MT MT per day
Wells drilled during the year Crude oil processed-total KL
daily average KL Natural gas sold-total MCM
MCM per day
Refined products sold-total KL
daily average KL Petrochemicals sold-MT
daily average MT
2024
511,013 1,400 471,935 1293 12,146 33 2 21,617,497 59,226 28,049,442 76,848 28,829,110 78,984 3,772,662 10,336
 63
