
Page 65 - CPC 2018 Annual Report
P. 65
FINANCIAL STATEMENTS 63
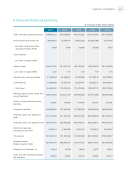
A Five-year Financial Summary
Sales and other operating revenues
Profit (loss) before income tax
per dollar of sales and other operating revenues (NT$)
Cash dividends
per dollar of capital (NT$)
Owner's equity
per dollar of capital (NT$)
General taxes and import duties Commodity tax
Total taxes
Working capital (current assets less current liabilities)
Ratio of current assets to current liabilities
Long-term Liabilities
Properties, plant, and equipment- gross
Properties, plant, and equipment-net
Exploration expenses (including all dry holes)
Total assets
Employed capital (Equity, long-term debt)
Employees on December 31
Sales and other operating revenues per employee
(In Thousands of New Taiwan Dollars)
2017
2016
2015
2014
2013
896,642,121 48,542,061
0.054
-
- 260,417,391
2.00 51,348,334 74,288,029 125,636,363
(56,879,637)
75.93% 126,590,000 913,710,040 430,577,501 2,195,701 745,046,121 387,007,391 14,814 60,527
764,629,993 35,430,707
0.046
-
- 221,475,417
1.70 44,638,861 74,581,051 119,219,912
(87,227,141)
64.93% 147,930,000 911,364,127 428,542,522 2,267,889 741,353,122 369,405,417 14,708 51,987
843,615,422 (1,402,323)
(0.002)
-
- 192,157,075
1.48 43,259,598 72,054,757 115,314,355
(87,408,206)
64.81% 177,920,000 904,641,954 428,472,574 2,947,919 741,965,890 370,077,075 14,693 57,416
1,191,814,302 (33,754,588)
(0.028)
-
- 193,597,425
1.49 57,752,016 70,639,775 128,391,791
(67,175,456)
79.37% 194,920,000 895,488,908 433,250,831 5,479,270 833,704,503 388,517,425 14,787 80,599
1,187,700,968 3,811,765
0.003
-
- 227,104,799
1.75 56,728,945 69,049,020 125,777,965
(28,798,456)
91.52% 194,820,000 887,182,381 444,802,139 5,246,458 878,932,667 421,924,799 14,819 80,147
